> ## Documentation Index
> Fetch the complete documentation index at: https://docs.finvera.ai/llms.txt
> Use this file to discover all available pages before exploring further.
# Using MCP to Plot Strategy Drift
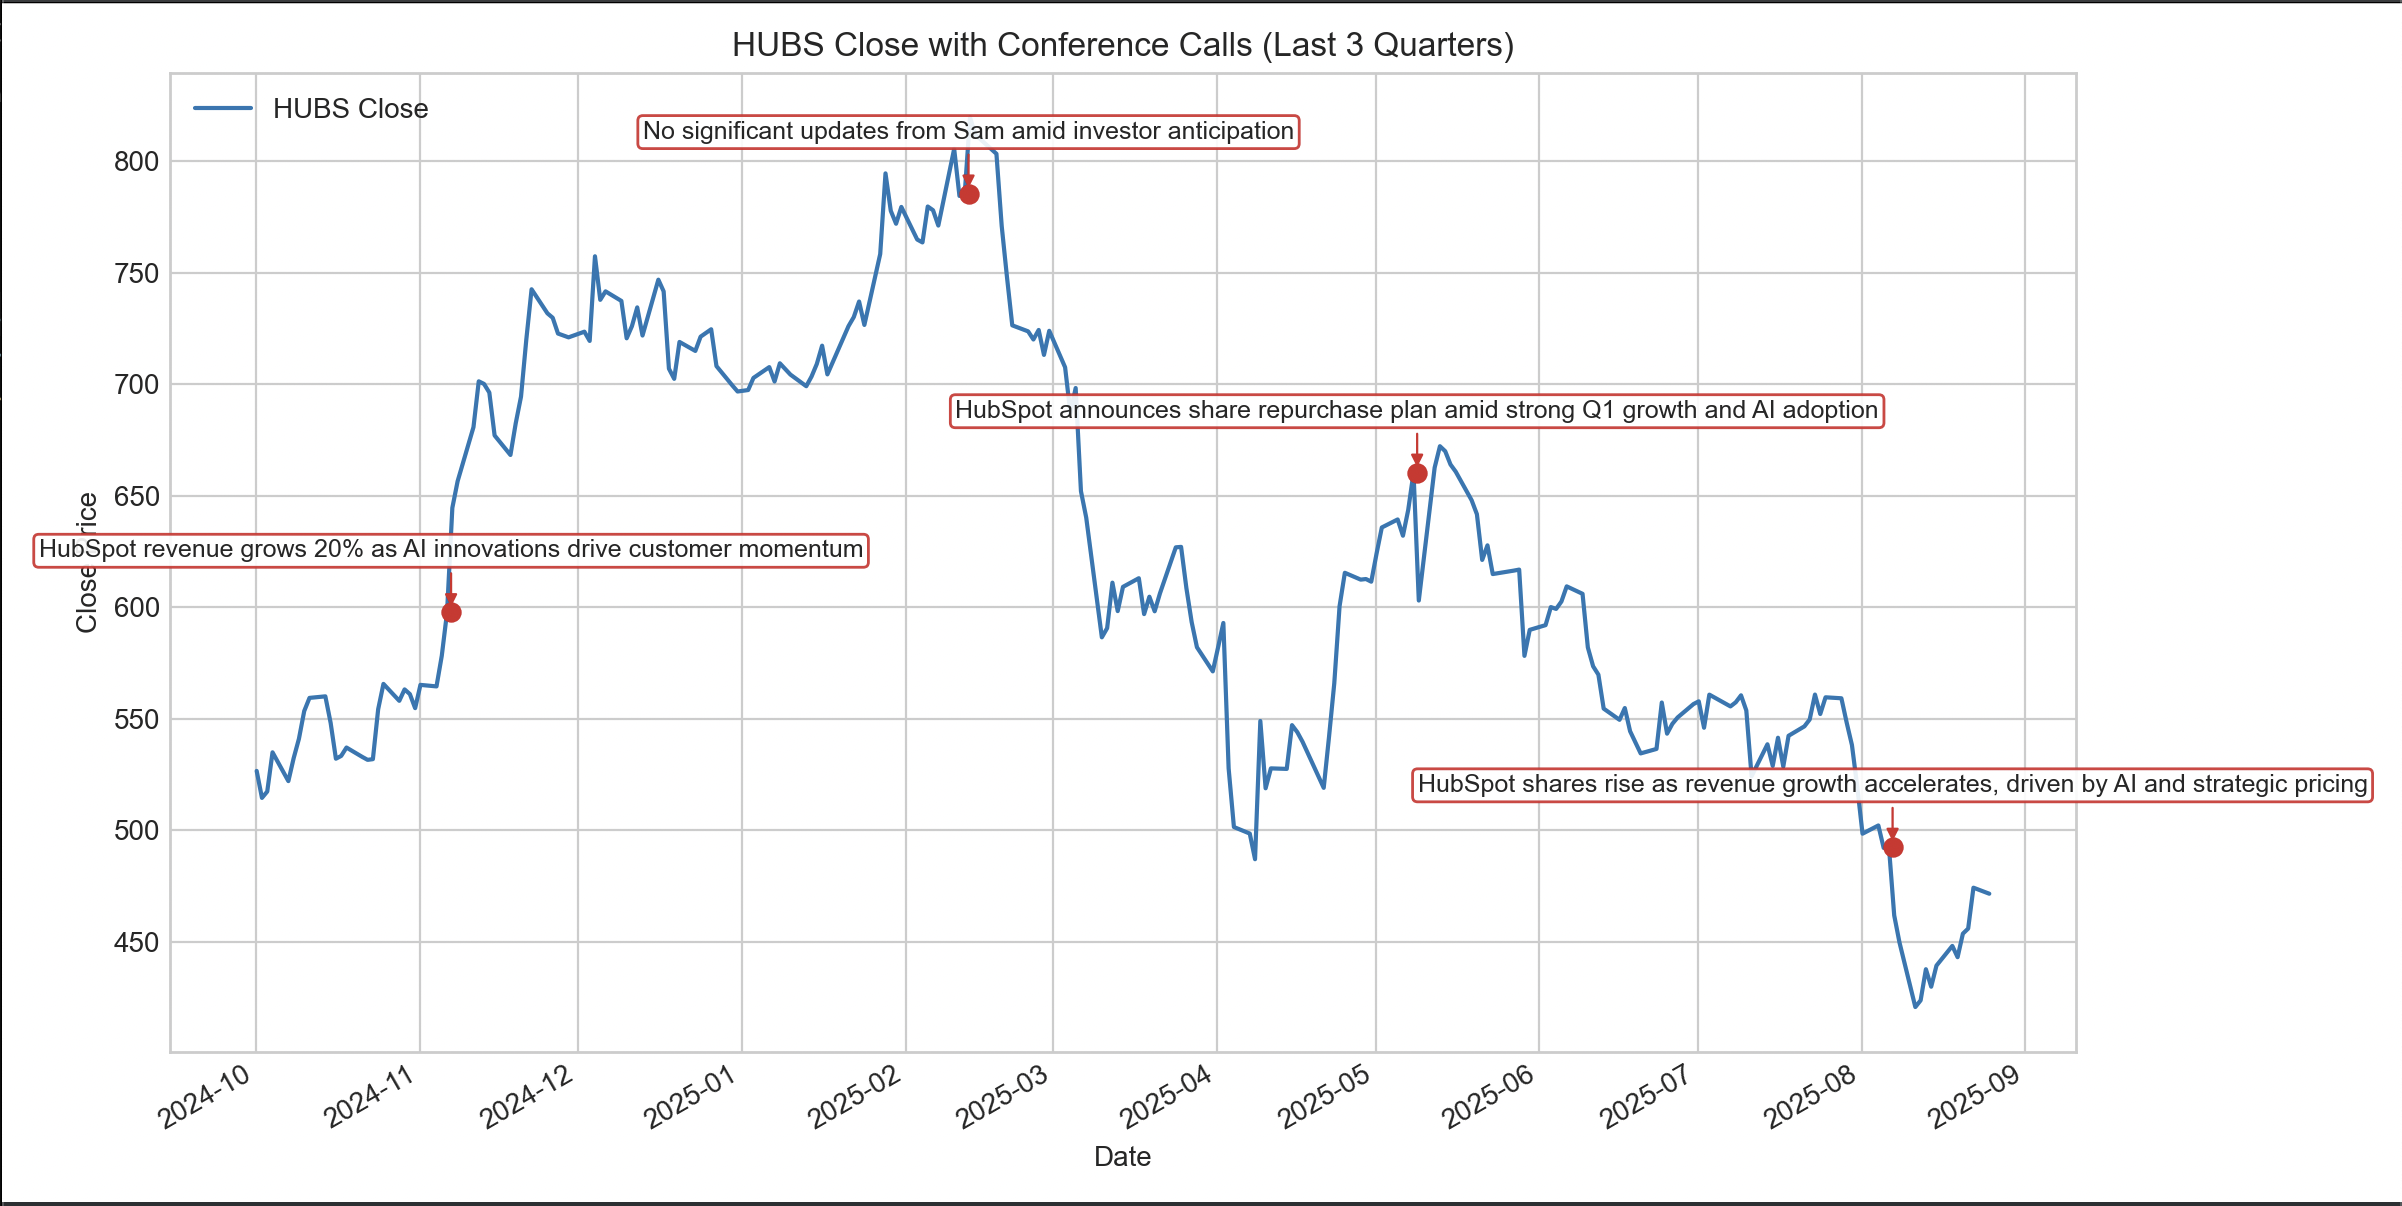
> Here is a tutorial of how to use the Finvera MCP server to track strategy drift
To create your free trial API key, you can head over to the [API Key Management Dashbord](https://dashboard.finvera.ai/sign-up).
### **Setup**
1. Set up the project in your AI IDE.
2. Prompt:
```markdown theme={null}
Use the Finvera APIs to retrieve OHLC stock data and the conference calendar for a given ticker (start with HUBS) over the last three quarters.
Requirements:
1. API Access
• Call the REST APIs directly.
• Load the API key from an environment variable named FINVERA_API_KEY (from .env).
2. Data
• Get OHLC data for the ticker.
• Get conference call events (conference calendar API).
3. Plotting
• Use Matplotlib.
• Plot only a line chart of OHLC data (no volume chart).
• Overlay and clearly mark conference call dates on the chart.
• Each marker should include the full conference call title.
• Ensure labels are readable and properly placed.
4. Time Range
• Fetch data for the last three quarters.
5. Implementation Notes
• Structure the script cleanly.
• Keep the visualization minimal, clean, and legible.
• Make sure all labels, markers, and annotations for events are visible.
```
3. Enter the chat with Cursor.
4. Check out the results. Cursor plots a series of annotations, over the stock price chart. These annotations are referenced from text within the Earnings Conference Calls.